What sold
Units sold, revenue, discounts, product, category, store, and date so you can separate demand from noise.
Retail POS resource
Before the next buying or markdown review, you need to know what is selling, what is stuck, what is running low, and which products deserve attention.
Why this template exists
A shelf count does not tell you whether a product is a winner, a problem, or just sitting in the wrong location. This template keeps item name and status first so you can decide what to reorder, transfer, promote, mark down, or watch.
Maven report preview
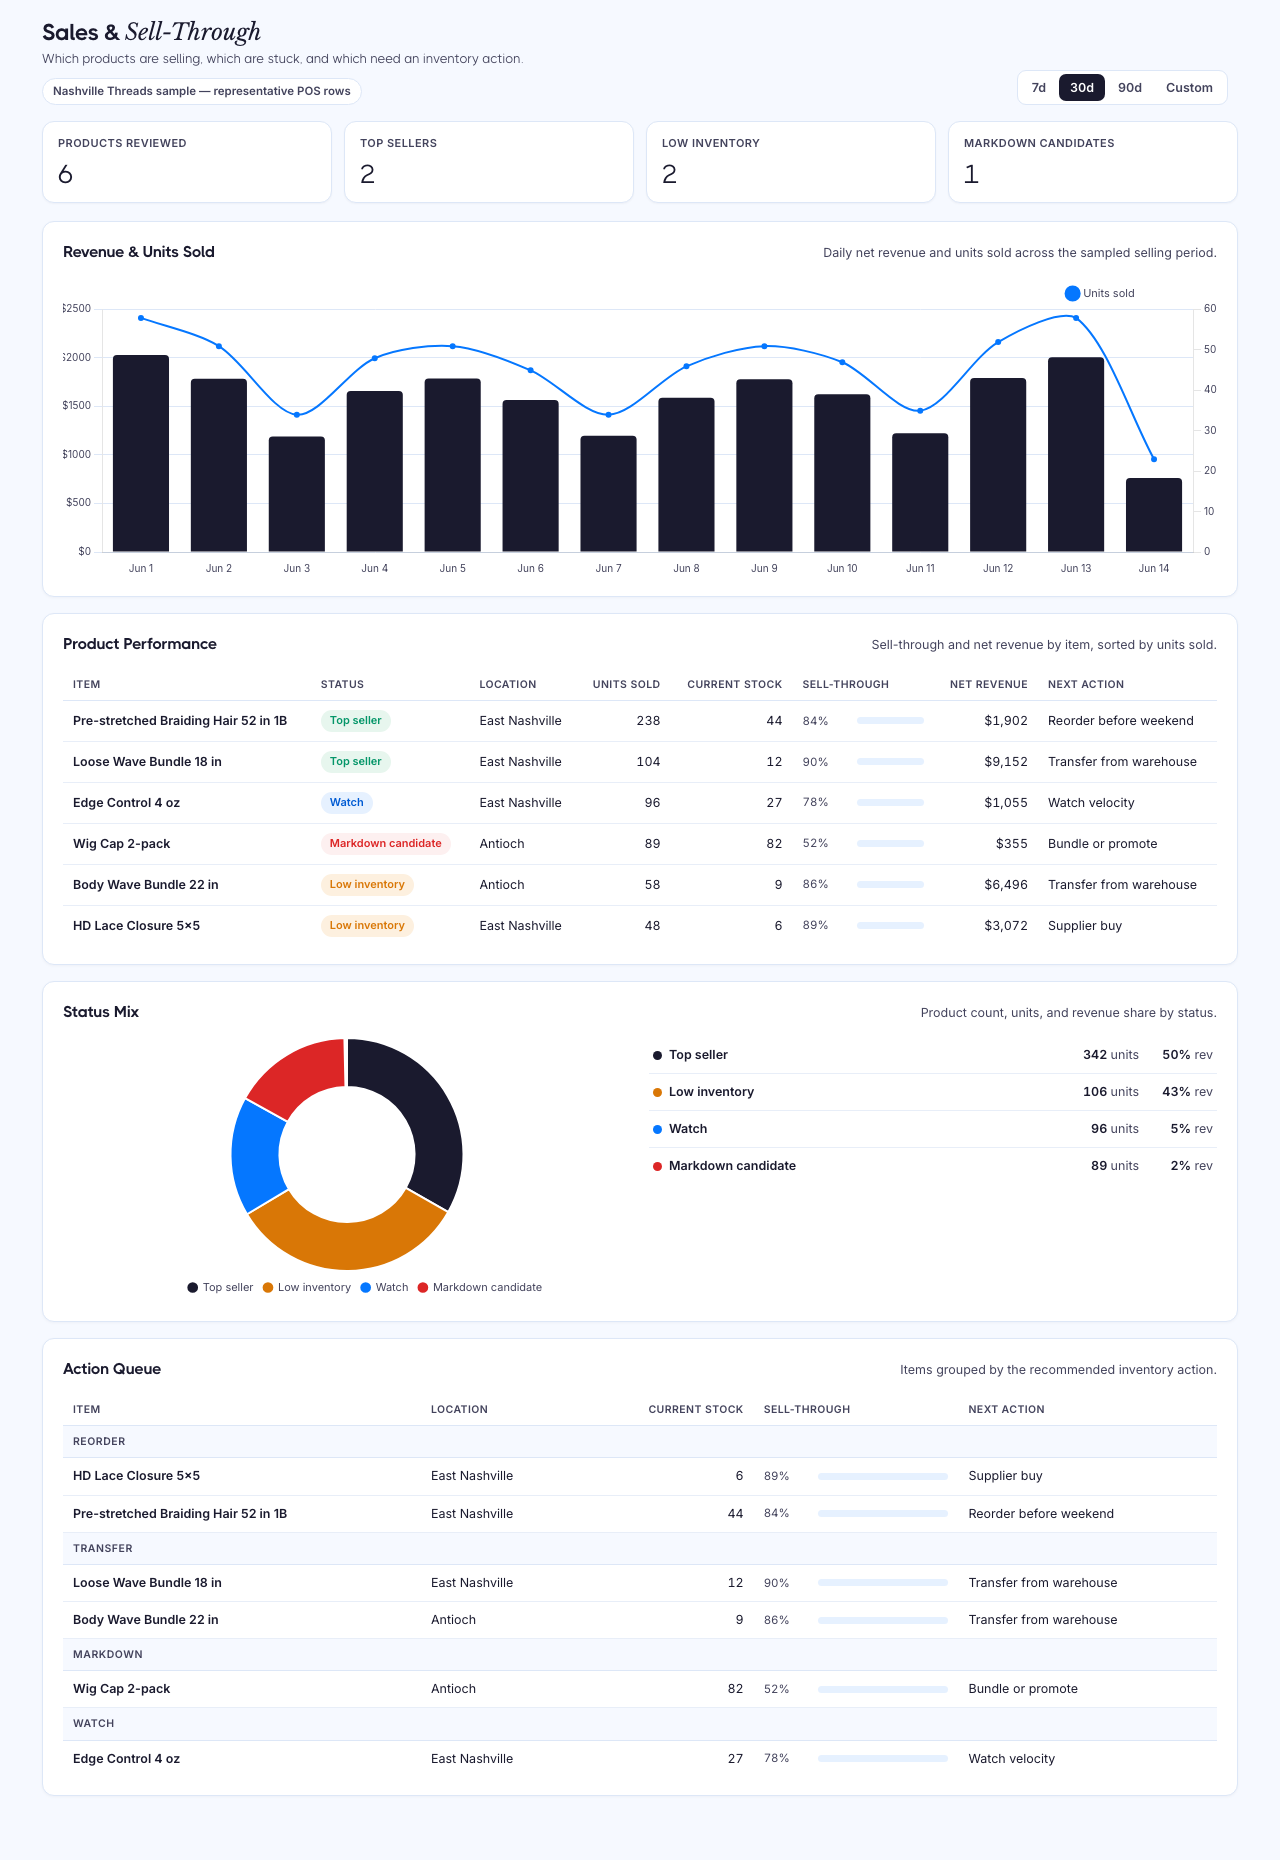
Preview uses Nashville Threads sample data from Maven's retail/POS demo set. In a demo, Maven builds the same report from your connected retail/POS sources and keeps missing fields visible instead of filling gaps with guesses.
What Maven evaluates
Units sold, revenue, discounts, product, category, store, and date so you can separate demand from noise.
Current stock by item and location so fast sellers do not quietly become stockouts.
Recent velocity and sell-through status so top sellers, slow movers, and markdown candidates are easy to spot.
Margin, cost, vendor, and purchase context are shown only when they are available, so the report does not guess.
How the report works
Review each product by location or channel before looking at totals.
See whether the item is a top seller, low inventory, slow mover, markdown candidate, reorder candidate, or watch item.
Decide whether to reorder, transfer, mark down, promote, replenish, or leave the item alone.
If a field is missing, treat it as a cleanup item before using the row for a purchase or markdown decision.
Retail source coverage
This view is strongest when your POS has both sales and inventory history. KORONA POS, Square, and Lightspeed are the core POS sources for this review. Shopify can help with ecommerce product performance, but it should not be treated as identical POS coverage unless your retail data is connected and verified.
Useful when you need product sales, store revenue, stock, movement, supplier, and category context in one review.
View integrationUseful when order, catalog, payment, and inventory-count history can explain what sold and what is left.
View integrationUseful when shop, product, vendor, inventory, and purchase context are available for retail decisions.
View integrationUseful for ecommerce product performance, inventory, revenue, discounts, and channel context.
View integrationRelated retail resources
Turn the sales and inventory signal into weekly restock, transfer, markdown, count-review, and supplier follow-up work.
Open resourceDashboardCheck whether stock counts and movement history are trustworthy before acting on sell-through signals.
Open resourceReportDrill into products where strong sales velocity and low stock indicate a supplier replenishment decision.
Open resourceOperator output
Item-first table with clear status labels
Top sellers, low inventory, slow movers, markdown candidates, reorder candidates, and watch rows
Units sold, current stock, sales velocity, sell-through rate, net revenue, and discount context
Optional margin, COGS, vendor, and supplier context only when supported by the source
Visible gaps when inventory, stock snapshot, cost, or vendor fields are missing
A demo path to see the same view on your own retail data
Sales and Sell-through Template FAQ
Download the CSV to shape the review, then book a retail reporting demo when you are ready to see what is low, stuck, discounted, or ready to reorder in your own store data.
Bring the sources and reports where the numbers do not match. We'll show how Maven gets you to trusted dashboards without a data team.
We'll map your first trusted dashboard
You'll see what Maven handles: sources, definitions, refreshes, and outputs
No pitch deck. No pressure. 20 minutes.